Threat Detection
Bot detection by rhythm: how Fourier transforms and frequency analysis expose bots
Most bot detection judges each request on its own, so a patient bot gets through. Scripts and malware keep time, and people do not. This article explains how a Fourier transform turns that timing into a visible peak, how jitter tries to hide it, and where rhythm fits beside the other signals.

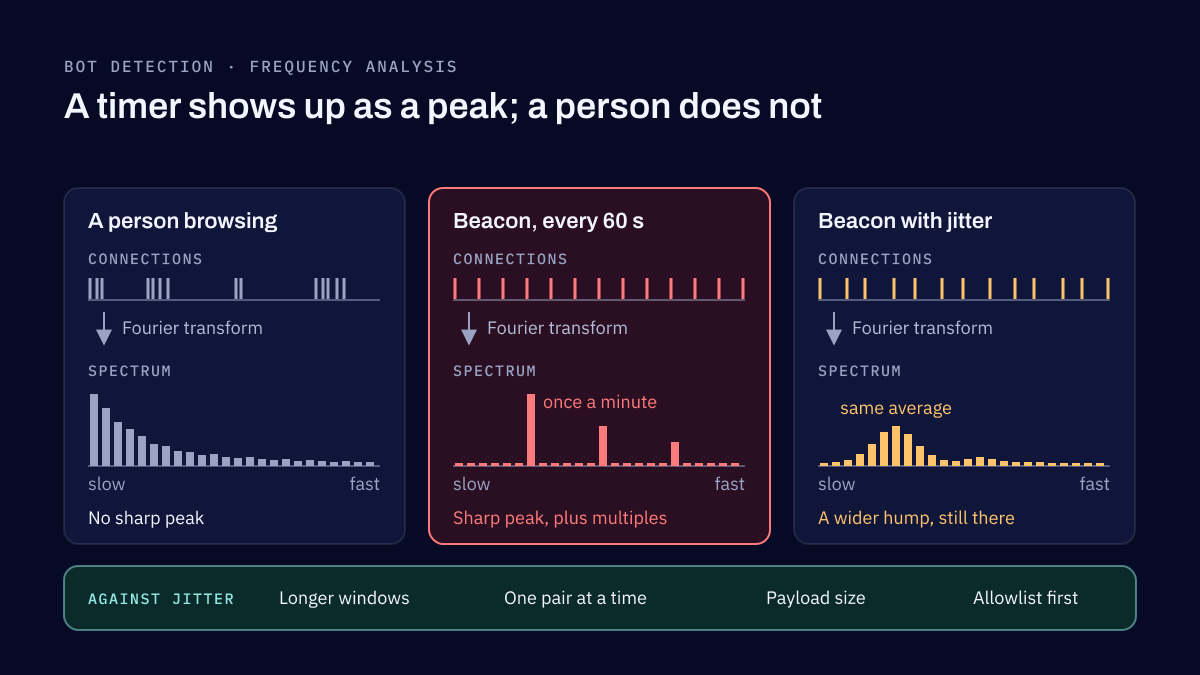
Bot detection is the work of telling automated activity from people, on a website, an API or a network. Most tools look at who is asking: the IP address, the browser's fingerprint, how the mouse moves. A quieter signal is when they ask. Scripts and malware act on a timer, and people do not. Frequency analysis, built on the Fourier transform, turns that timer into a peak you can see, even when each request looks human and stays under every rate limit.
This article explains how that works in plain terms, how attackers try to blur the rhythm, what else keeps time on a normal network, and where rhythm fits beside the usual bot detection signals.
What bot detection usually looks at
Imperva's 2025 Bad Bot Report found that automated traffic made up 51% of web traffic in 2024, and that bad bots alone were 37%. Most of that is caught by familiar signals: a known bad IP address, too many requests from one place, a browser that is not really a browser, a visitor who never moves the mouse, a challenge the script cannot answer.
All of these judge requests one at a time, or a few at a time from one source. A patient bot can make every one of them look fine. We have seen credential stuffing kept just under the login rate limit, with a gap between attempts so steady no person could keep it. We have seen a scraper spread its requests across many IP addresses, each one quiet enough to pass, all of them keeping the same beat. Neither tripped a rule. Both had a rhythm.
Bots keep time, people do not
People act in bursts. They read, click three links, stop for coffee, come back, open a tab and forget it. The gaps between their requests are irregular and cluster around their working day.
A script sleeps. It waits a fixed interval, acts and waits again. Malware does the same when it calls home. Command-and-control beaconing is an infected machine checking in with its operator's server, to report and to collect instructions, and it does so on a schedule. Cobalt Strike's Beacon, a commercial tool used by red teams and copied by attackers, checks in every sixty seconds by default, according to its own user guide. We have found exactly this kind of steady check-in on a host whose endpoint protection had not flagged the software behind it.
A steady schedule is easy for a computer to keep and hard to hide, because it is a pattern across hours of activity, not a property of any single connection.
How a Fourier transform hears the rhythm
Take one source and one destination, say a laptop and an address on the internet, and count the connections between them in each second of a day. You get a long row of numbers, mostly zeros, with a one wherever a connection happened.
A Fourier transform takes that row and asks, for every possible rhythm, how strongly it is present: once a second, once every ten seconds, once a minute, once an hour. The answer is a spectrum, one strength for each rhythm. A beacon that connects every 60 seconds produces a sharp peak at once a minute, with smaller peaks at its multiples (twice a minute, three times a minute) because each connection is a short spike. A person's browsing produces no sharp peak. Its strength is spread out, mostly over slow rhythms such as the working day.
For readers who want the formula, this is the discrete Fourier transform as NumPy's documentation defines it:
A(k) = Σ a(m) · exp(−2πi · m·k / n), summed over m = 0 … n−1, for k = 0 … n−1
Here a(m) is the count in time slot m, n is the number of slots, and A(k) measures the rhythm that repeats k times across the whole window. In practice the transform is one function call, and the useful number is how much of the total strength sits in the strongest peak: high for a timer, low for a person.
It is not the only way to find a rhythm. Elastic Security Labs described a beaconing framework in 2023 that uses autocorrelation, which compares the activity with a shifted copy of itself and looks for the shift where they line up. Both methods ask the same question in different ways: does this activity repeat?
Jitter, and why it only blurs the peak
Attackers know about timing analysis, so beacons add jitter: a random change to each wait. Cobalt Strike's guide gives the example of a 300-second sleep with a 20% jitter, so each check-in varies by a random percentage up to that factor.
Jitter does not remove the rhythm. It smears it. The sharp peak becomes a wider hump around the average interval, and the smaller peaks at the multiples fade first. Over a few minutes of data the hump is lost in the noise. Over a day it usually stands out again, because the average interval stays the same however much each wait varies. Elastic's framework models jitter directly for the same reason.
Four habits keep a jittered beacon visible:
- Longer windows. Look at a day or more of connections, so the average rhythm shows through the randomness.
- One pair at a time. Analyse each source and destination pair on its own. A whole network mixes thousands of rhythms into noise.
- Payload size. Add how similar the bytes sent and received are each time. A beacon that has nothing new to report sends nearly the same amount every time.
- Allowlist first. Remove the services known to be regular before looking, so what remains is worth a look.
What else keeps time
A lot of legitimate software is regular too, and it is the main source of false alarms:
- Updaters and agents: antivirus, operating system and software updaters, time synchronisation and telemetry agents all call home on a schedule.
- Monitoring: health checks, uptime monitors and the monitoring tools themselves.
- Integrations and scheduled jobs: API integrations, backups and cron jobs.
- Chat and mail clients: Teams, Slack and mail clients polling or keeping connections open.
These belong on the allowlist once someone has confirmed what they are. Sometimes the confirmation is the finding. We have traced a steady rhythm to a script or integration nobody had documented. It was not an attack, but nobody knew it existed, what credentials it held or who owned it, which is a problem of its own.
Where rhythm fits in bot detection
Rhythm is one signal, not a verdict. Fingerprinting, IP reputation and behavior catch most bots, and timing catches the patient ones they pass. On a website, combine it with what the browser reveals, such as a headless browser or no mouse movement at all: a steady rhythm from a client that also never moves the mouse is a strong case. On a network, weigh it by how rare the destination is. A regular rhythm to an address only one host contacts is worth far more than one to a service every machine uses.
Start with a hunt, not an alert. The first runs will surface the updaters, the monitors and the forgotten jobs. Once those are allowlisted and the scores are stable, the rhythm check can become a detection rule. Free tools help with the first steps: RITA, from Active Countermeasures, analyses network logs and gives each connection a beacon score you can sort and filter.
Putting it in your SIEM
The data is usually there already. A practical sequence:
- Collect connection or request logs with exact timestamps: firewall or proxy logs and DNS for beacons, web server or WAF logs for web bots.
- Group them by source and destination for the network, or by account and endpoint for the website.
- Drop the allowlisted services.
- Score each group's rhythm over a day or more, with payload size alongside.
- Rank the results, hunt through the top of the list and record what each one was.
- Turn the patterns that hold up into a rule, with a runbook that says what to check first.
This is the kind of work we do in a Threat Detection & SIEM Implementation: detection rules written for your logs and mapped to MITRE ATT&CK, each tested and handed to your team with its runbook. An implementation usually takes 2 to 4 months, at a fixed price or on time and materials. Your team runs the detection afterwards; we do not operate a monitoring service. If you want to know whether your team would notice a real adversary at all, a red team operation emulates one and shows you, and red team vs penetration testing explains when that is the right test. AI agents that act on schedules raise the same questions of who is acting and how often, which our article on agentic AI security covers.
Frequently asked questions
How do you detect bots on a website or a network?
By combining several signals, because no single one decides. On a website, the usual ones are IP reputation, rate limits, the browser's fingerprint and how the visitor behaves, such as mouse movement. On a network, they are the destinations a host contacts and how often. Timing is the signal that catches the patient bots the others pass, because a script keeps a rhythm that people do not.
What is command-and-control beaconing?
It is malware on an infected machine checking in with its operator's server at regular intervals, to report and to collect new instructions. Cobalt Strike's Beacon, a tool used by red teams and by attackers, checks in every sixty seconds by default. That regular check-in is what frequency analysis looks for.
Can jitter hide a beacon from frequency analysis?
It makes the beacon harder to see, not invisible. Jitter varies each wait at random, so the sharp peak a fixed timer would make spreads into a wider hump around the average interval. Looking at a day or more of connections, one source and destination pair at a time, and adding how similar each payload is, usually keeps that hump above the background.
Do you need a data scientist to use frequency analysis?
No. A Fourier transform is one function call in common libraries such as NumPy, and free tools such as RITA already score connections for beaconing. The skill is in the hunt around it, allowlisting what is known to be regular and reading the results, before any of it becomes an alert.
Sources
- 2025 Imperva Bad Bot Report: how AI is supercharging the bot threat, Imperva, 2025
- Cobalt Strike user guide: asynchronous and interactive operations, Fortra, 2026
- Identifying beaconing malware using Elastic, Elastic Security Labs, 2023
- Discrete Fourier transform (numpy.fft), NumPy v2.5 manual, NumPy, 2026
- RITA (Real Intelligence Threat Analytics), Active Countermeasures, 2026
SIEM implementation and threat detection
We deploy a SIEM, connect the log sources that matter, write detection rules mapped to MITRE ATT&CK and hand the platform over with runbooks. Your team operates it afterwards; we don't run a monitoring service.
Related reading
Threat Detection
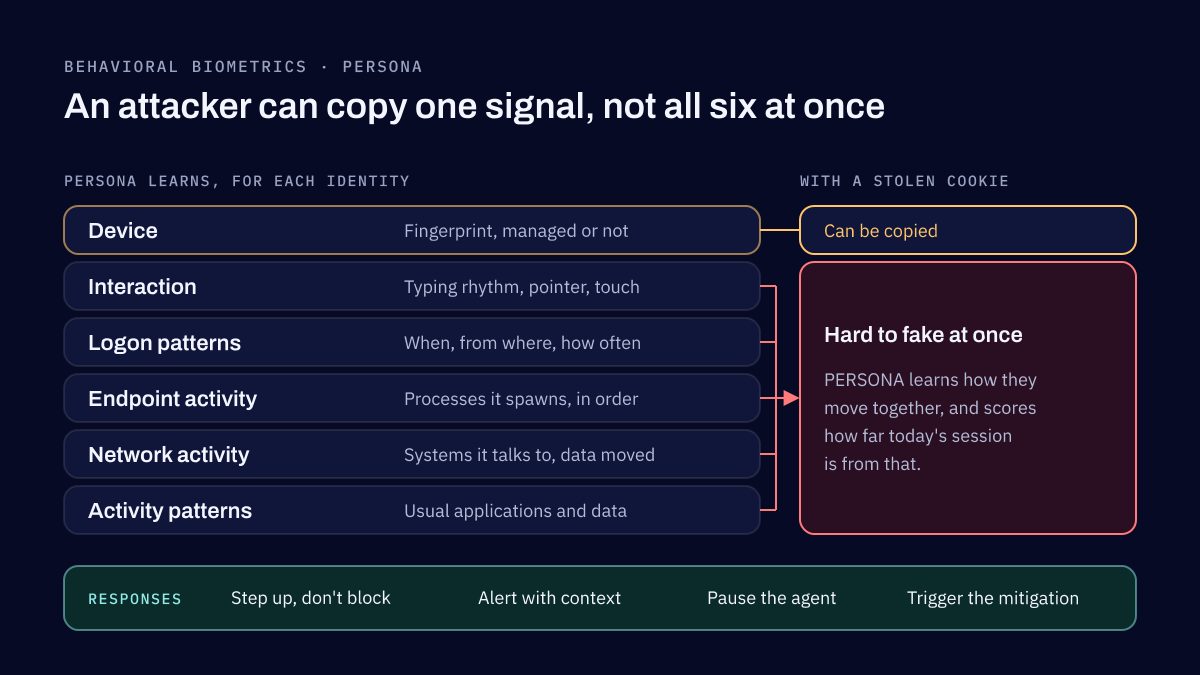
Behavioral biometrics with ML: PERSONA, a multimodal view of every user, device and AI agent
Behavioral biometrics identifies a user by how they act, not by what they know or carry. Combined with a device fingerprint and session context, and built with machine learning, it gives a profile that shows when an account, a device or an AI agent stops behaving like itself. PERSONA is our name for that profile.
Threat Detection
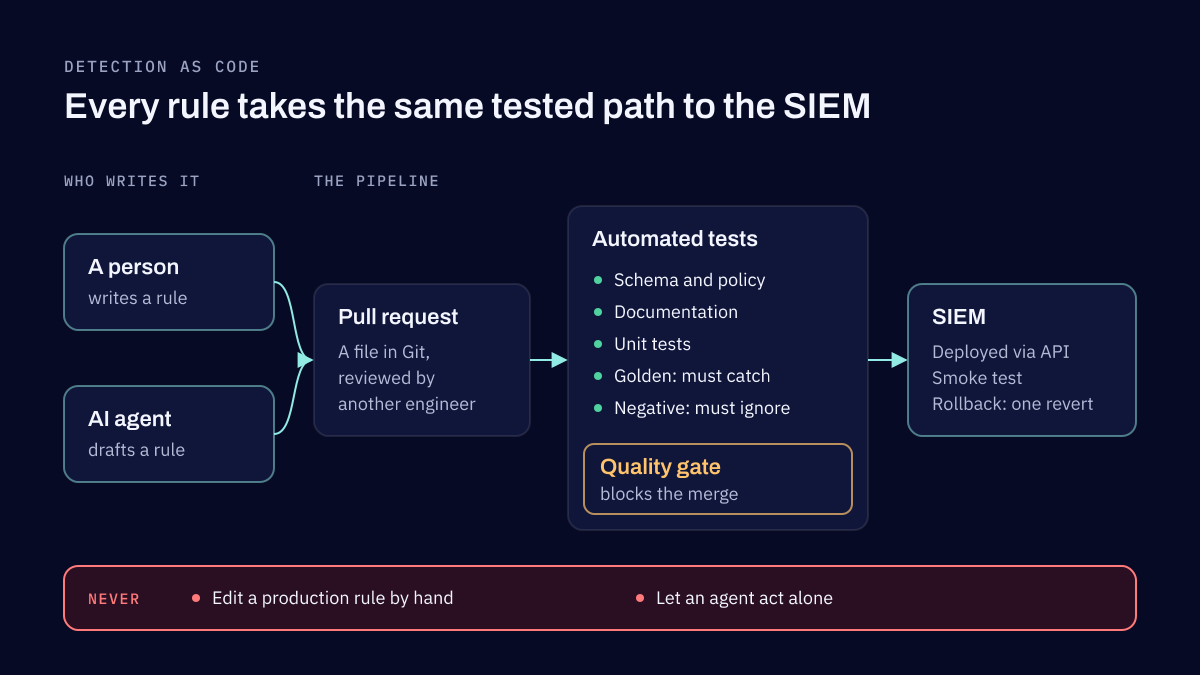
Detection as code in the agentic era: CI/CD strategies for detection engineering teams
Detection as code is managing detection rules the way developers manage software. Rules live in version control, are written in a portable format such as Sigma, are reviewed through pull requests, are tested automatically in a CI/CD pipeline and reach the SIEM only through that pipeline.
Tell us what you need to detect
Name your systems and the requirement behind the project. We reply within two business days.